ONLINE DATA VISUALIZATION MADE EASY

SELECTED COMPANIES TRUST ALEGER

VISUALIZATION OF YOUR DATA WITH JUST A FEW CLICKS

No more tedious and lengthy editing of Excel files and the like. With ALEGER data visualization you save a lot of time when it comes to evaluation and reporting. With one click, you have a wide variety of KPIs and business-relevant figures displayed in various tables, charts and diagrams.

DECIDE BASED ON DATA

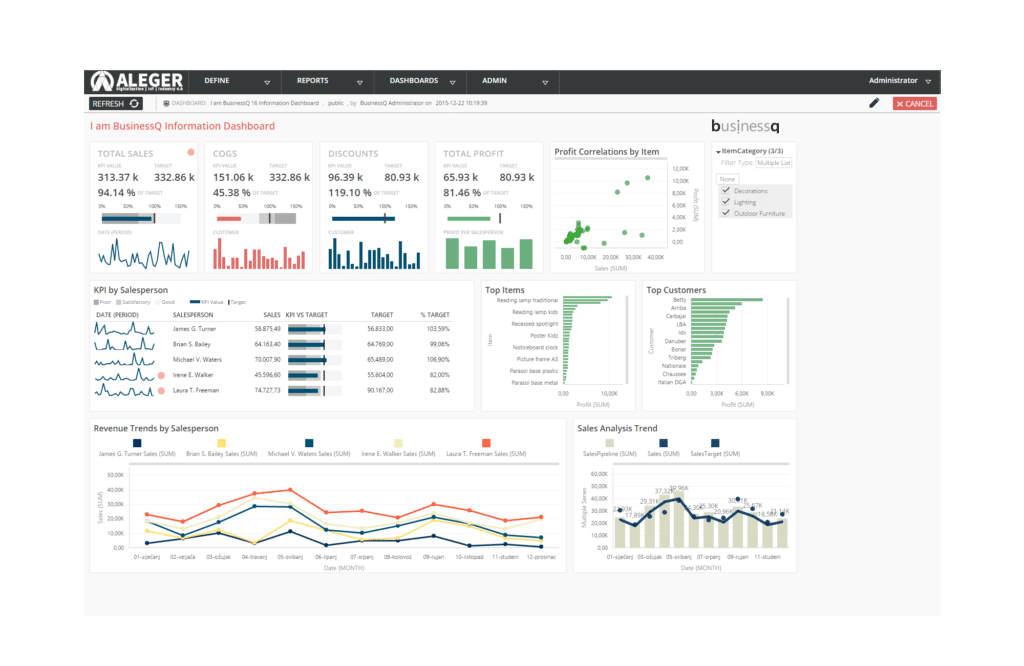
Our data visualization tool collects raw data from sources such as Excel and CSV files and renders it into accurate real-time reports.

REDUCE COSTS

Save time and money with automated data processing. This allows you to devote your time to the important things, such as the further development of your company.

OPPORTUNITIES USE

Create forecasts based on artificial intelligence. At the same time, irregularities can be detected at an early stage, and problems can be avoided.

ONLINE REPORTING

Stay agile with your reporting. This means that management has access to the latest data for strategic decisions 24 / 7.

With an analysis platform, ALEGER provides deep insights into your business

DATA VISUALIZATION WITH ALEGER

Do you want to have your business figures presented clearly and always in up-to-date reports? With our online platform for data visualization this wish comes true. No matter if it is sales, warehouse, purchasing or other business relevant KPIs. With the simple and intuitive web application, you can automate your recurring reports and business reports, as well as identify issues in advance while identifying additional business opportunities.

Save yourself the time-consuming and tedious creation of reports. Once the data sources you need (e.g. Excel, CVS, Oracle, MySQL…) are linked to our web app for data visualization, you’ll have your head free for the important things in your business.

AUTOMATIC DATA VISUALIZATION FOR YOUR INDUSTRY

DISTRIBUTION

STORAGE

WAIT IN ADVANCE

E-COMMERCE

IN 3 STEPS TO FULLY AUTOMATED DATA VISUALIZATION

CONNECT
Connect your data sources such as CSV & Excel files, Oracle, MySQL, Microsoft SQL etc. with the easy-to-use data connector.

CREATE REPORTS
Without writing a single line of SQL code. Easily build your interactive reports and bring your raw data to life.

Visualize data
Combine and organize your data from reports and easily create your custom dashboards with drag and drop. This way, you can always stay up to date on your business figures.

A HUGE SELECTION FOR DATA VISUALIZATION

You have a wide range of visualization options. Display your reports and analyses in a wide variety of tables, graphics and charts. No matter if standard or pivot table, horizontal, vertical, pie charts, scatter & bubble plots or KPI maps & matrix

WHY WE ARE THE NUMBER 1 IN ONLINE DATA VISUALIZATION

Data visualization must be simple and intuitive. That is exactly our promise to you – no more and no less!

ON ALL DEVICES

The webapp works on all devices and in any browser (IE Explorer, Chrome, Firefox, Safari, ....)

ARTIFICIAL INTELLIGENCE

We use machine learning and AI for pattern recognition. In this way, errors are detected at an early stage but also extremely accurate forecasts are generated.

DRAG & DROP

Create and customize dashboards as well as reports in minutes to suit your needs.

DATA SOURCES

Easily integrate with existing data sources such as Microsoft SQL Server, Oracle MySQL, PostgreSQL, Excel & CSV files.

ROLES AND RIGHTS

Assign access for specific people & departments to a wide variety of dashboards and reports.

CUSTOM BRANDING

It is your data, reports and evaluations. Then display them to employees and third parties under your brand and corporate design.

LEARN MORE ABOUT THE DATA VISUALIZATION WEB APP NOW

Fill out the form now and one of our data visualization experts will get back to you right away!

Select the fields to be shown. Others will be hidden. Drag and drop to rearrange the order.
  • Image
  • SKU
  • Rating
  • Stock
  • Availability
  • Description
  • Content
  • Weight
  • Dimensions
  • Attributes
  • Custom attributes
  • Custom fields
Click outside to hide the compare bar
Compare

Jetzt Termin für kostenloses Web-Demo vereinbaren

Wir rufen Sie umgehend zurück

Make an appointment now for a free web demo

We will call you back immediately